
If I take a MBTI test before Coffee – I am an ISFP and post that I mellow down to a warm INTJ- and that is what is wrong with the MBTI.
MBTI fails the basic criterion of Statistical Reliability- i.e. A psychometric test needs to produce the same result taken over a course of time, but MBTI fails this basic test . And still an Industry exists which evaluates people on this sham and not only that- people are getting “certified” as MBTI Assessors.
Here are 5 concepts in statistics every HR manager must know
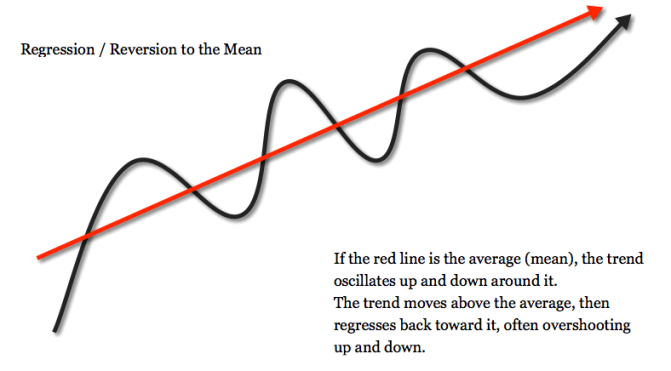
Regression to Mean
Regression to mean is easily discernible in Sports- If N’Golo Kante Scores 7 Goals in a season/i.e. 0 .18 Goals per game while his Goals per match before the season were 0.06- this does not mean he has become an offensive midfielder; and you will see that in the Next couple of seasons he will be back to his earlier average. Or if you like Cricket and see Kohli hit 6 centuries in 6 matches in 2 series- ; over a period of time he will get back to his average range which is around 50-55- still great but not Bradman great.
I once ran an Insurance sales operation for 9 months. ;One of the methods of detecting fraud is to watch spikes in a persons performance without any causal link to quality of data, training or better insurance product. Sustained spikes more often than not indicated a new way to miss-sell insurance. Otherwise it would settle down – regress to the mean performance of the person. Performance improvement is different- it moves up gradually as the person learns to his/her job better and learns new skills.
In Human Resources- we deal with more subtle differences – for example an engagement survey timed after an outdoor team building exercise will not be the right measure- Real engagement is a function of culture and culture is a long term artefact- it does not change in months or even quarters- takes couple of years to get the right reading ! Same goes with performance improvement analysis post a training intervention- unless they sustain over a period of time and do not regress to mean- it means it was a momentary spark and caused by another factor rather than training or something as simple as the Hawthorne effect
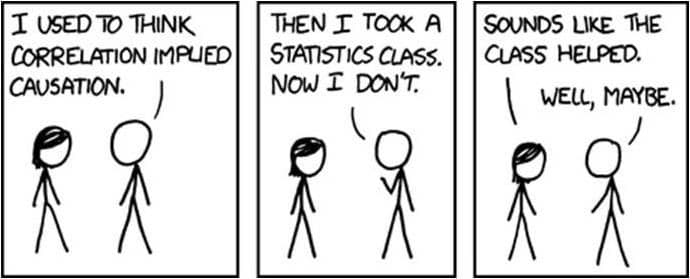
Correlation is not Causation
Ken Rogoff & Carmen Reinhart studied the data of 20 advanced countries from 1946 to 2009 and concluded – ” when the debt to GDP ratio goes beyond 90% the countries get thrown into recession”. The Republican party in US and the conservative party lead by David Cameron in UK used it to announce austerity cuts which resulted in hardship through cuts in social spending and many people losing their jobs.
An analysis of the study later found that their were omissions in the data, incorrect weight allocation and if there is a is a correlation between economic growth and the debt/GDP ratio it is the other way round – slow growth raises the debt ratio
A lot of Studies have suggested Charismatic leaders are more successful . But a detailed study by Agle, Srinivasan & Nagarajan published in the Academy of Management journal ( 2006) analysed and found that Successful CEO’s were perceived as more charismatic. p.s Successful leaders were perceived to be taller than their real height also
Information Asymmetry
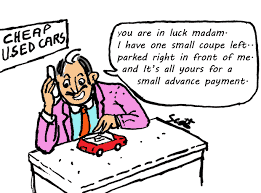
Information Asymmetry is the difference between how your Second hand car looks when you buy it and how it performs after 6 months ;). In stock market the “insider ” has more information than the retail investor and can win big if he / she uses this information to play the stock markets.
Ironically in organisations the “insider” has a disadvantage. A lot of organisations tend to hire from outside basis limited information and reject an internal and better candidate – because they know too much / have too much data on the person. So a external candidate gets hired on potential and an internal one gets rejected because their is more data on performance & attitude
The Likert Scale
Engagement analysis, Culture analysis, even 360 Appraisals use Likert scales. Questions like- Do you think your organisation provides you enough opportunities for learning or Does your leadership team walk the talk on values the organisation stands for are usually followed by strongly agree, agree, not sure, disagree & strongly disagree. Likert scales suffer from some common ailments!
- Central Tendency Bias- For example in the above example- people are likely to mark not sure – to avoid making decisions or take extreme/strong positions
- Acquiescence Bias- Agreeing with statements as presented
- Social Desirability Bias- Attempt to portray yourself or your company in a favourable light
Ideally Likert scales need to have even choices so that the central tendency error is removed- Strongly Agree, Agree, Disagree & Strongly Disagree ( remove not sure) .
Likert scales are analysed using Medians and Inter Quartile Range- because using average and standard deviation means there is an equal distance between Strongly Agree & Agree and between Disagree & Agree. So if you use a HR instrument which takes information like the example given above but uses Mean & Standard deviation for analysis- they most probably do not know what they are doing.
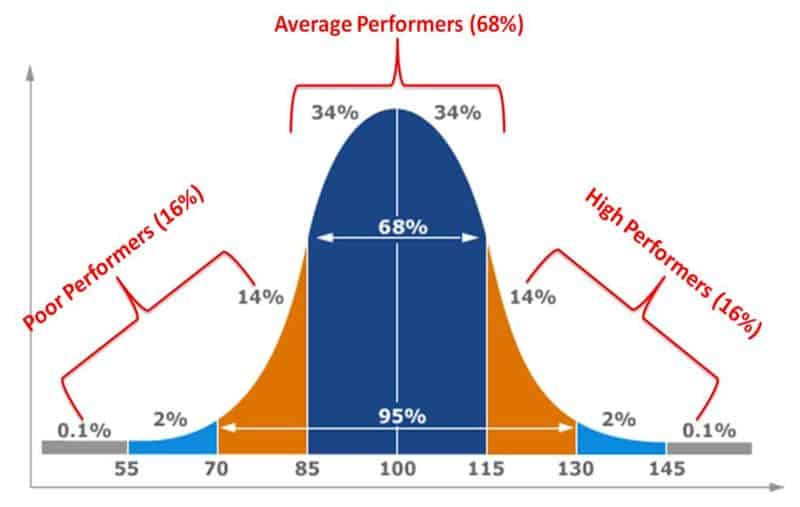
Bell Curve Distribution & Power Law Distribution
Bell curves are getting a bad rep- companies are discovering they are not the right tools to analyse performance and consequently a rather incorrect basis for deciding compensation. But that is not entirely true- Bell Curves will work just fine for well defined work done by a large group of people – Assembly line workers, Delivery workers, even retail.
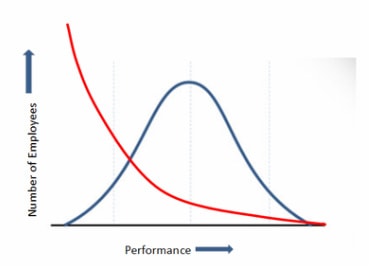
Where Bell curves really “sk(r)ew” the analysis is when its used for performance dependent on lots of defined / undefined variables or when its used to analyse performance of professions like – Software Development, Product Development , Consultants, even Solution selling because Performance in these categories follows the power law distribution- where the difference in performance is extremely high between the average and the good.
Reed Hastings at Netflix believes that the average difference between an average and the best is not 5X it is 10 X . Steve jobs used to say the difference between average and great software engineer is 100X. Hastings goes on to extrapolate this to differentiate between operational and creative roles. In operational roles the productive differences are not so much ,but in creative roles they can be humongous .So customer service is an operational role but content curation and creation are creative roles in a firm like NetFlix.
In my experience for Recruitment ; the best outperform the average by at least 20 X , if not more . Unfortunately very few HR teams make career or compensation differentiation between their best and average performers in Recruitment. The best firms realise the capacity of this single function to improve the organisation.
References
- Standard Deviations: Flawed Assumptions, Tortured Date and Other Ways to Lie With Statistics- Gary Smith
- Goodbye to MBTI, the Fad That Won’t Die by Adam Grant in Psychology Today
- Does CEO Charisma matter ? An Empirical Analysis Agle, Nagarajan & Srinivasan
- Analyzing & Interpreting Data from Likert Type Scales – Journal of Graduate Medical Education, December 2013
- Netflix CEO on paying sky-high salaries: ‘The best are easily 10 times better than averag